Introduction
An online, interactive mapping and timeline project that tells the story of the rise and fall of urban communities that grew their own food in the 20th century United States. Using population and agricultural census documents, oral histories, sample household survey data, photos, maps, aerial photography, and satellite imagery, the project created a platform to travel through time and space to see how changes in landscapes, land use, and infrastructure affect community well-being.I worked on this project within a cohort of ~30 undergraduate research assistants. We were grouped by topic to research such as Housing, Food, Health, Transportation, Community, etc. My group and I focused on historical research regarding community life in Deanwood, D.C. I looked through historical documents, such as newspaper ads and address books, and geolocated food businesses to visualize food (in)accessibility over time with a voronoi diagrams.

Explanation
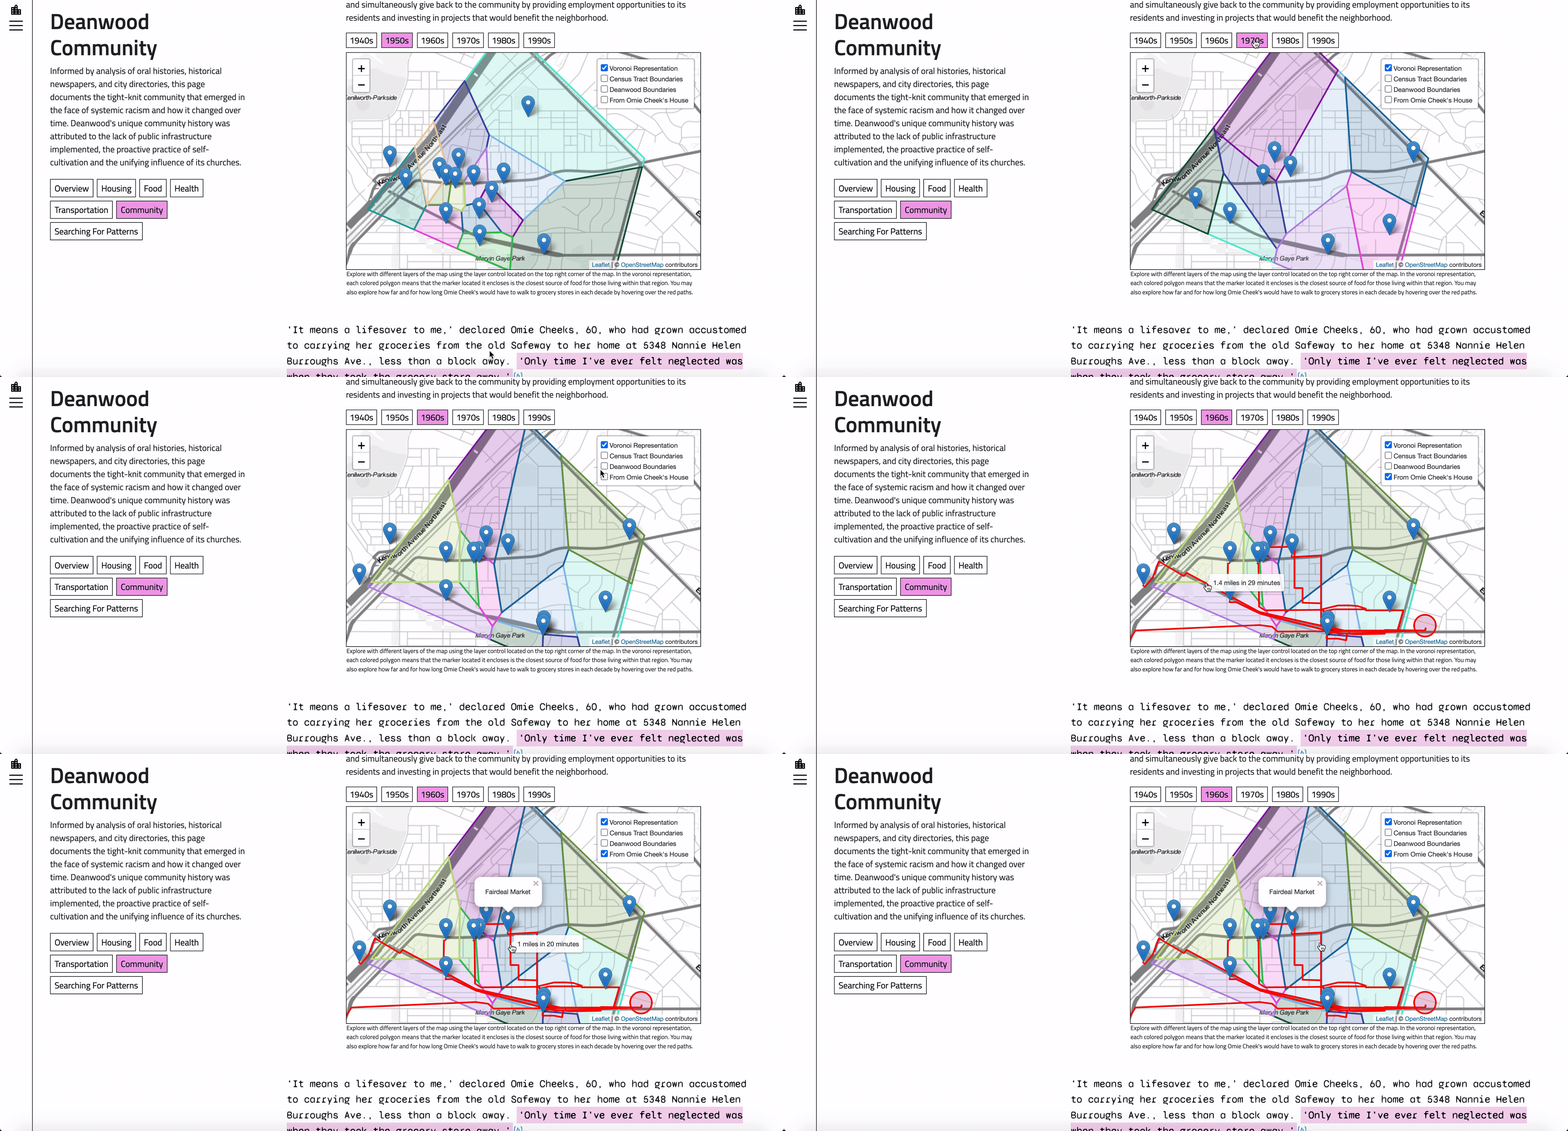
Voronoi diagram is a partition of a plane into regions close to each of a given set of objects.I had learned of what a voronoi diagram was through my research at MIT's Senseable City Lab and thought it would be a useful way to visualize food insecurity within Deanwood D.C.. Each point on the map/plane represents a grocery store. The voronoi diagram divides the plane into regions based on the distance to the grocery stories. Each region consists of all points closer to one particular grocery store than to any other. Areas in the Voronoi diagram that are far from any grocery store, or regions where a single store's region is exceptionally large, highlight the distance which one living in that region must travel to access food.
When looking through historical documents, I found many testimonies from Deanwood residents regarding the access to food stories. I happened to be able to cross reference one resident, Omie Cheeks, with an address book to find out where she was living at the time. Wanting to highlight lack of food access through the eyes of this elderly woman, I mapped the shortest path from her home to every food store and calculated how long it would take to walk to each.
