Introduction
"Family Separations" is a data-journalistic web page documenting the family separations that occurred at the US-Mexican border under Trump’s Zero Tolerance immigration policy. Made by analyzing a data set retrieved by the American Immigration Council through the Freedom of Information Act. It includes a scrollytelling narrative and interactive map based visualization. I worked within a group of four on data analysis, prototyping and development.It was made for the class 11.154 Big Data, Visualization, and taught by Professor Sarah Williams.

Inspiration
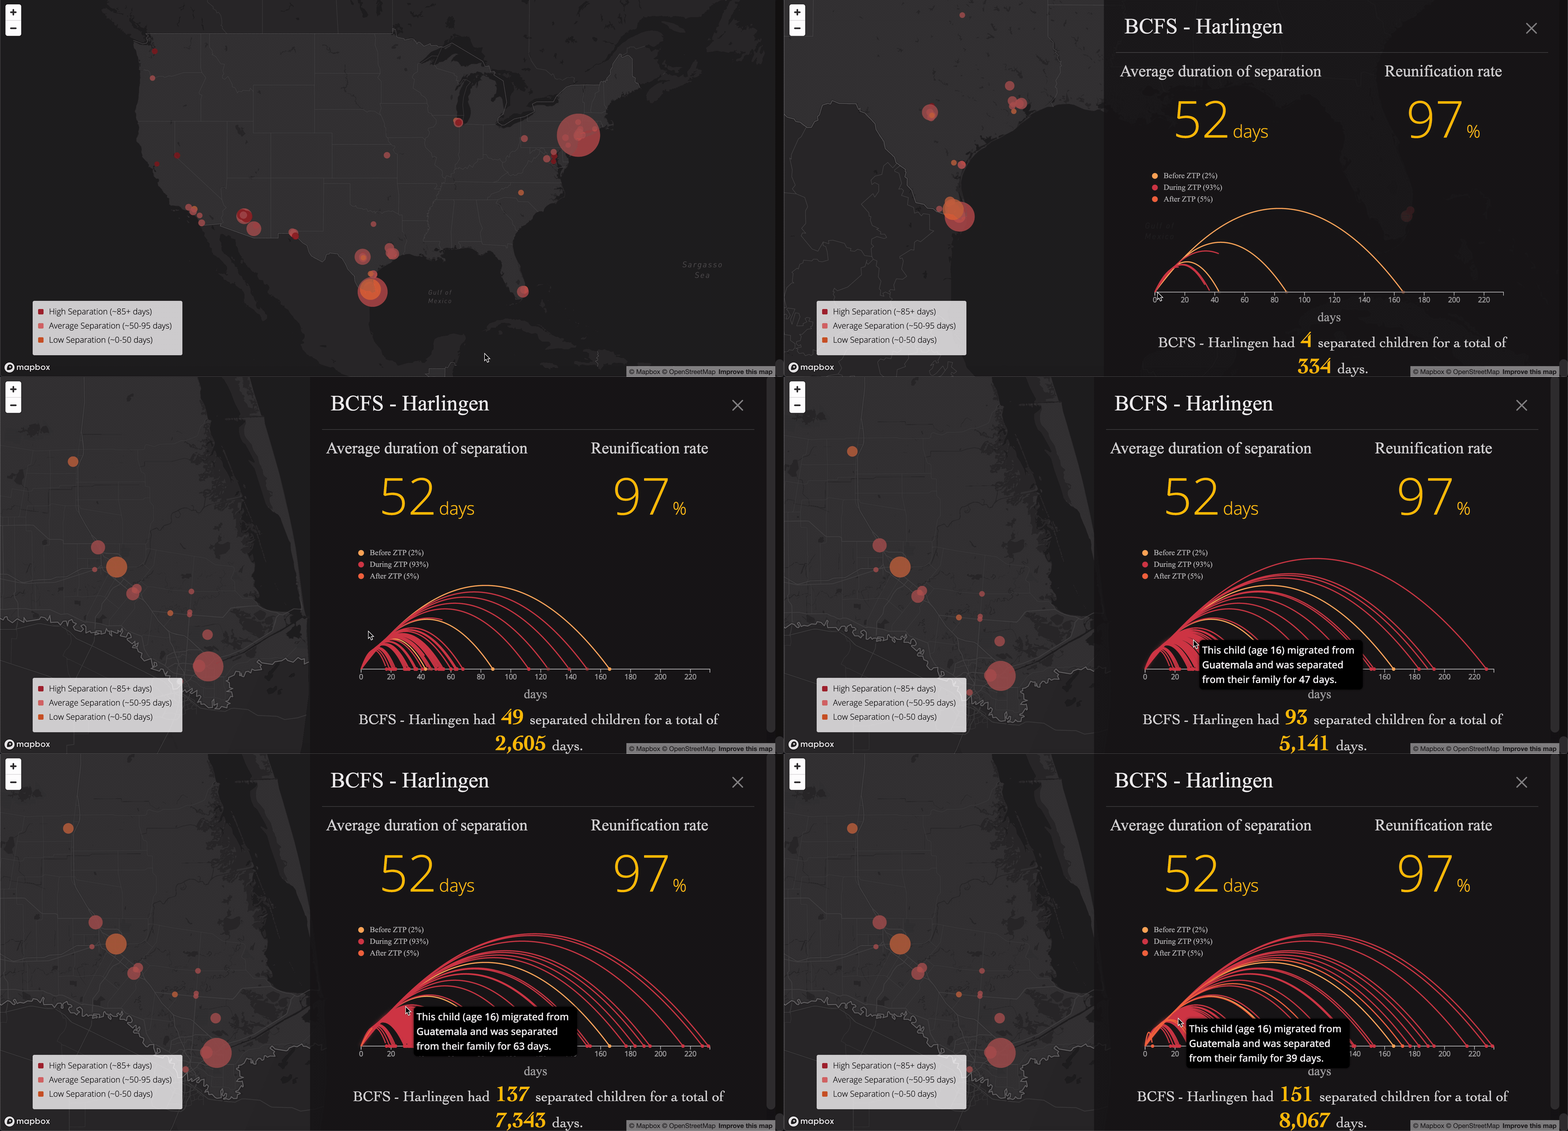
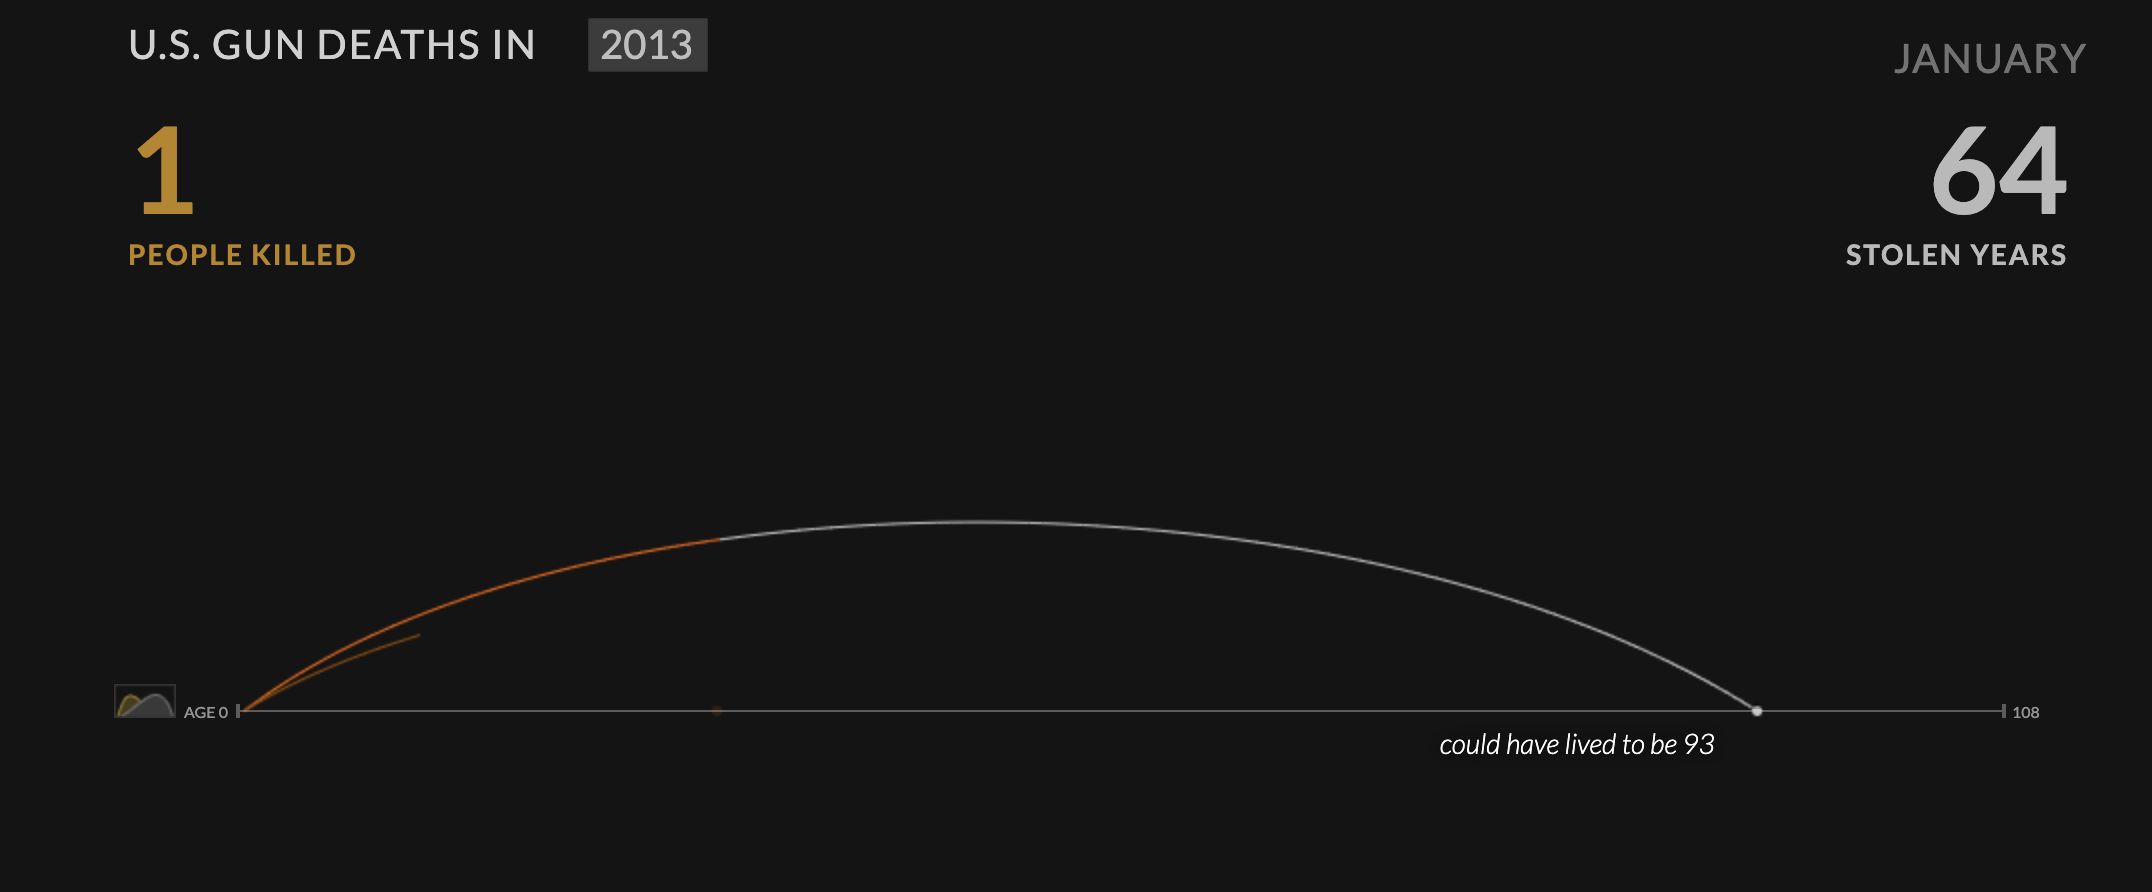
We were particularly inspired by Periscopic's "U.S. Gun Deaths" data visualization which emotionally represents each life lost to gun violance as an unfinished arch. The number of "stolen years" are aggregated to measure the impact of gun violence.We adapted the design for our use case of measuring the impacts of Donald Trump's Zero Tolerance policy in terms of days separated. Each point on the map represents a detention center, with the size of the point related to the number of children it detained. Clicking on a point will open up a panel to reveal its statistics, including an animated arc diagram. Each arc represent a separated child, with the radius of the arc as a reflection of the amount of time which they were separated. We sought to add more emotional resonance to the data by humanizing each data point - hovering over each arc will reveal the age and country of origin of the child it represents.
