Introduction
A "Citizen" inspired equity mapping tool highlighting geographic disparities in 311 services among neighborhoods in Philadelphia, along with a 311 reporting chatbot service.
The application was prototyped for the class Civic Tech Prototyping, taught by Sarah Williams in the Fall 2022 semester. In my implementation of the tool, I was heavily inspired by the Spatial Equity Tool which I had worked on prior.
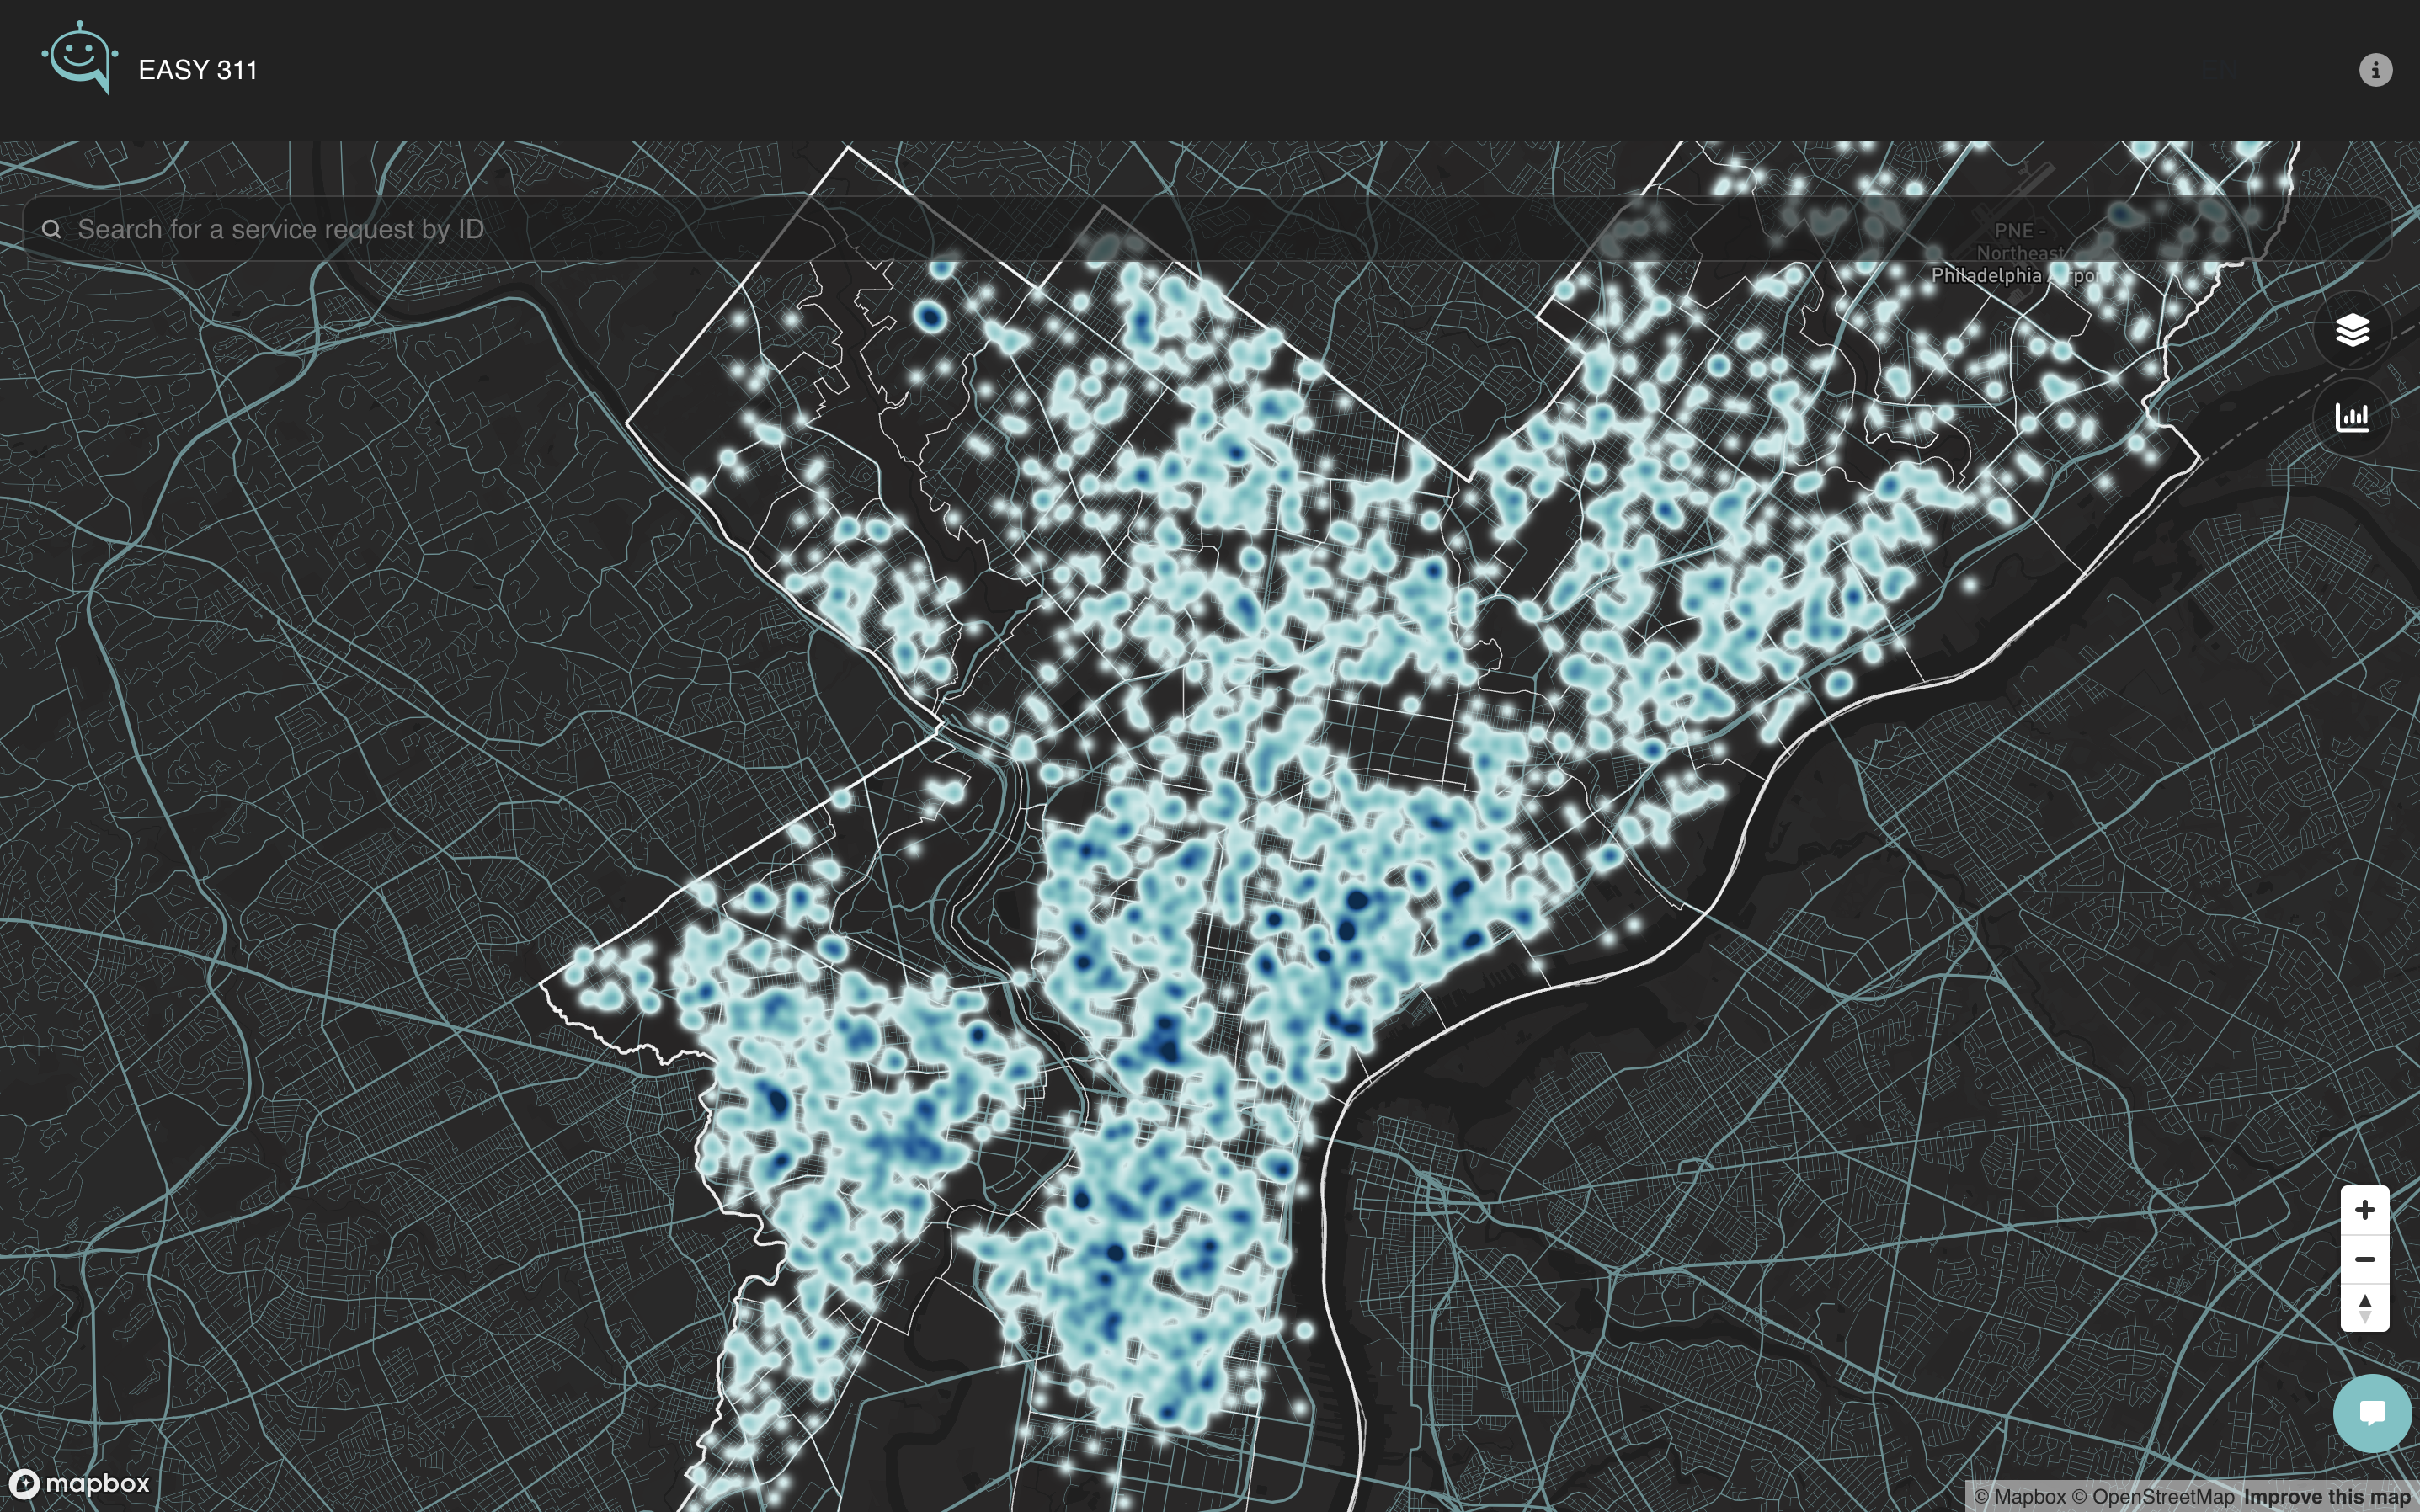
Features
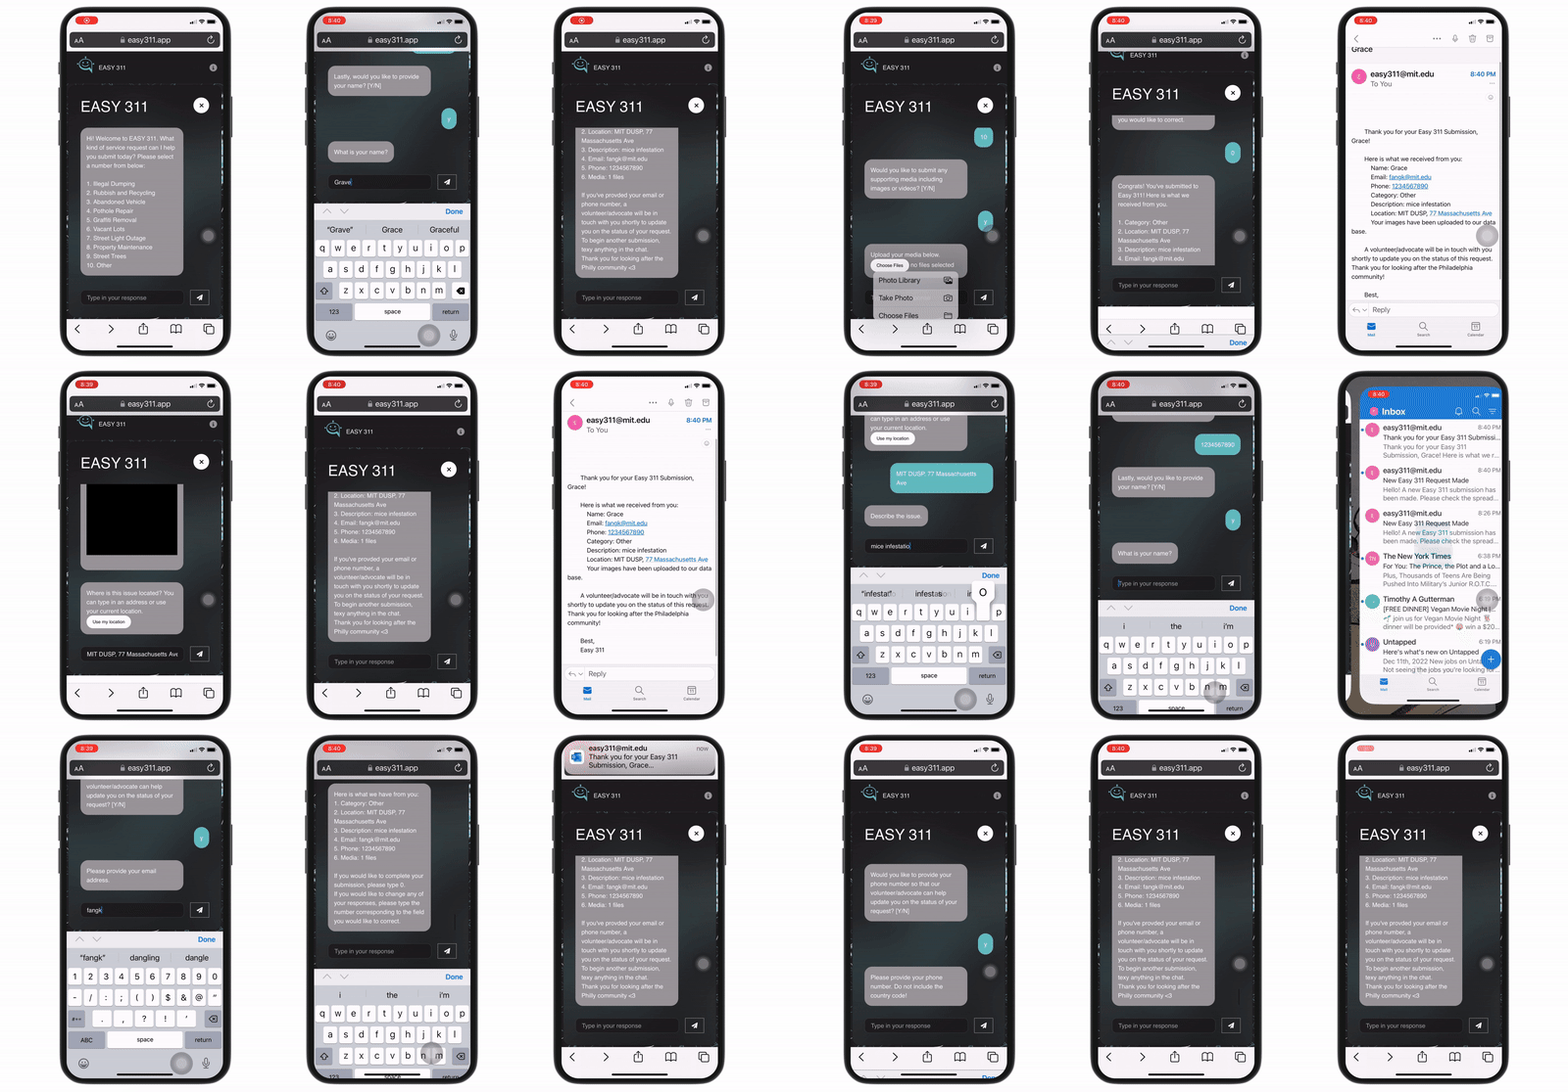
Chatbot
The chatbot only requires the user to submit a category for their request, a description of the issue, and the location of the issue. It provides a widget to upload files by selecting from the user's photo library or taking a picture, as well as a geo-location widget. Before submission, the chatbot presents a summary of the user's input for verification and allows edits if necessary. If the user provides an email address, a confirmation email will be sent detailing their submission.
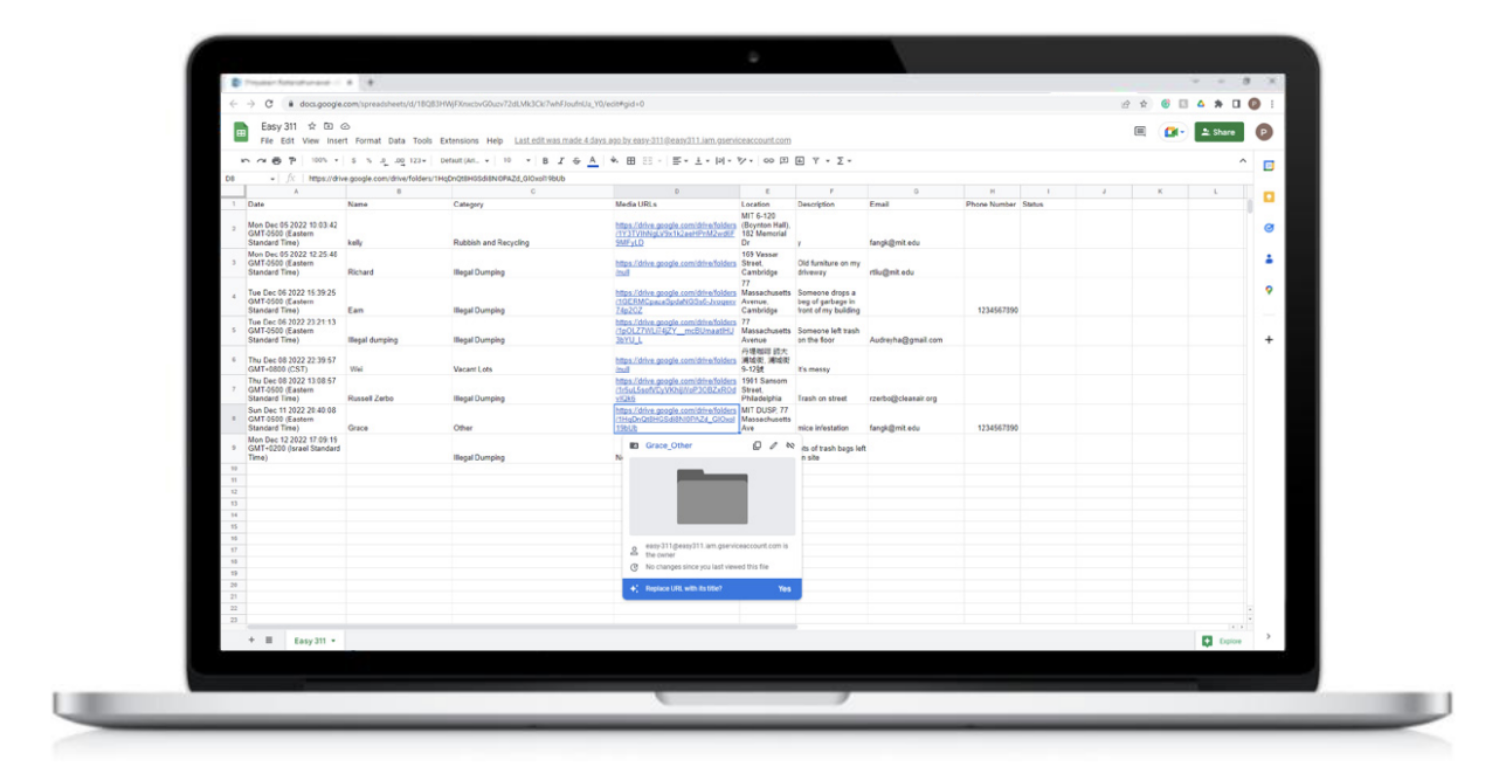
Request logging
If the user provides images, EASY 311 will use its “upload* media” endpoint to create a new folder in Google Drive for the images using the Google Drive API. EASY 311 will also use its “write* sheets” endpoint to write a new row into Google Sheets with the user’s submission using the Google Sheets API. Upon successful submission, EASY 311 will use Twilio’s SendGrid API to notify an email list of EASY 311 partners and volunteers about the new submission. From there, EASY 311’s partnered volunteers will help the user submit their request through Philly311.
Request Map
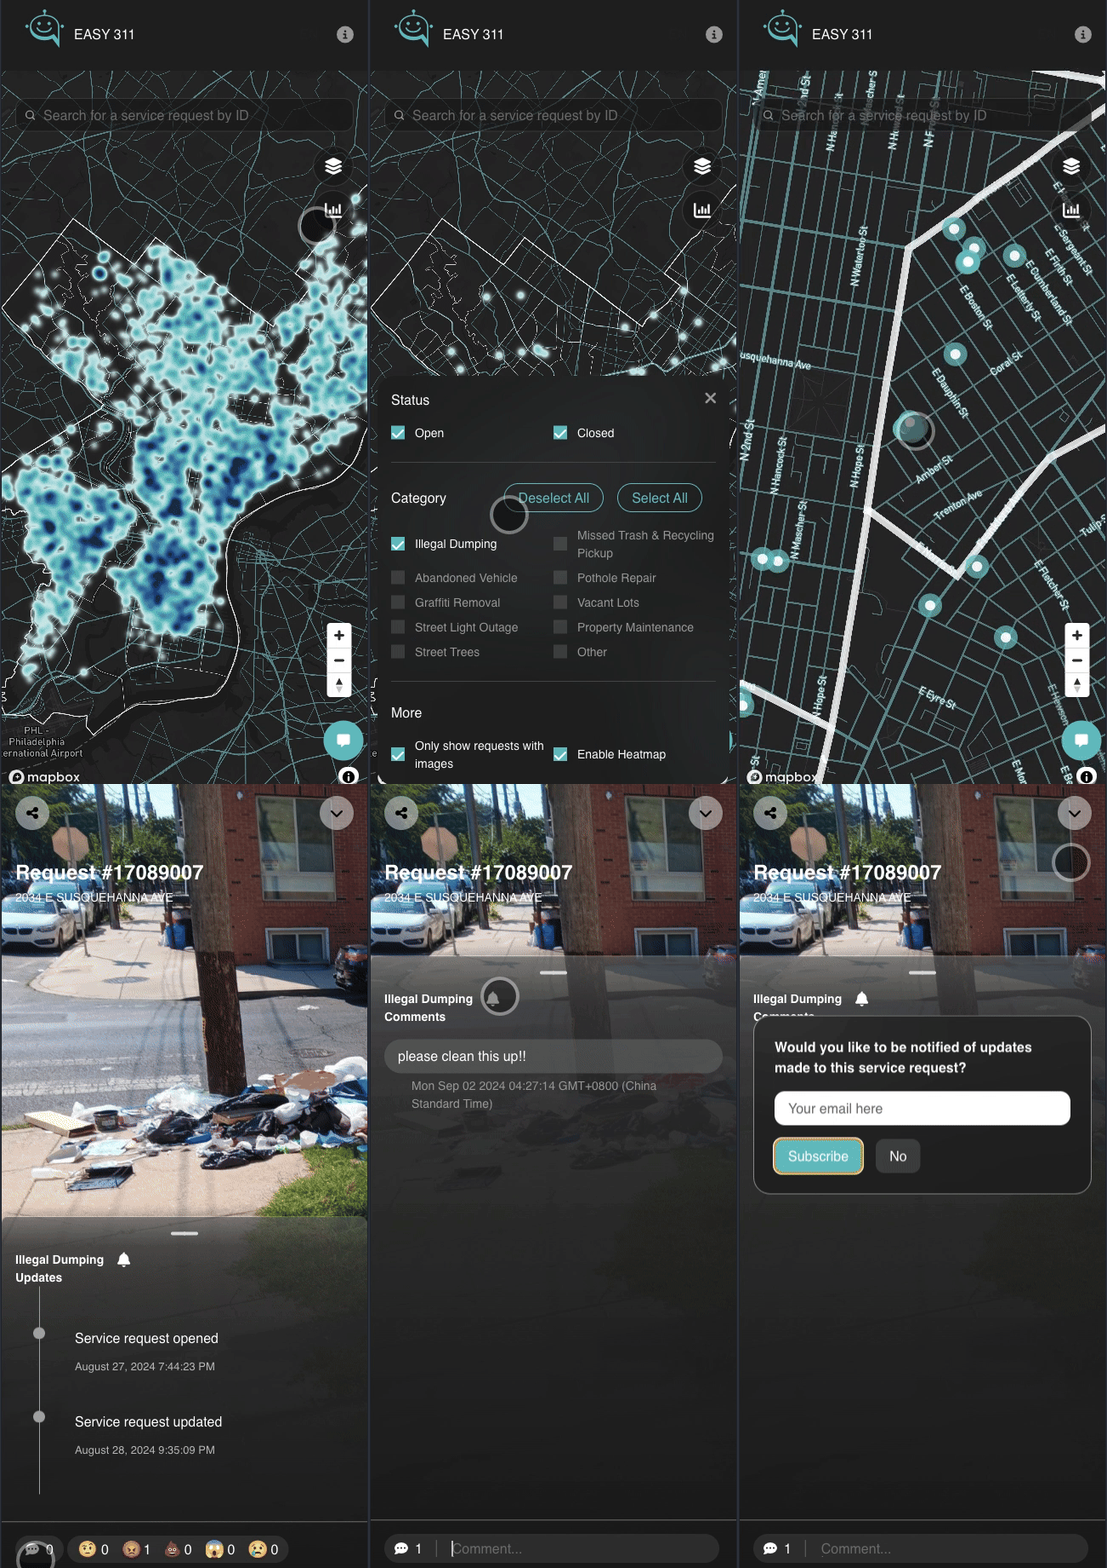
EASY 311’s map visualisation spatially visualises 311 service requests with layers that are easily filterable.
When zoomed out, the map visualisation will show a heatmap of 311 service requests. The heatmap allows for users to identify service request hotspots and clusters.
Selecting on a heatmap cluster will zoom the map into the cluster. The heatmap layer will disappear and be replaced with a point data layer so that users can explore each data point individually by clicking on them.
When a data point is clicked, a panel will open up to review the images associated with the service request (if any) as well as a timeline of status updates. From here, the user also has the option to make comments about the request and react to it.
Neighborhood-Aggregated Data Analytics
EASY 311 aggregates and visualises 311 request data for users to understand where in the city 311 service is underperforming and in what categories. We were inspired by the Spatial Equity tool which aggregated data to useful geographic + political boundaries to highlight disparities between communities.
Users can search for specific neighborhoods, zip codes or addresses in the search box and calculate statistics over several different time frames (last 24 hours, last 7 days, last 30 days) using the drop down.
Users may also access this data visualisation panel by interacting directly with the map.
Also like Spatial Equity, When the user clicks on the map, EASY 311 will automatically determine which neighborhood the user’s selected coordinates fall under and open up the data visualisation panel with the corresponding analytics.
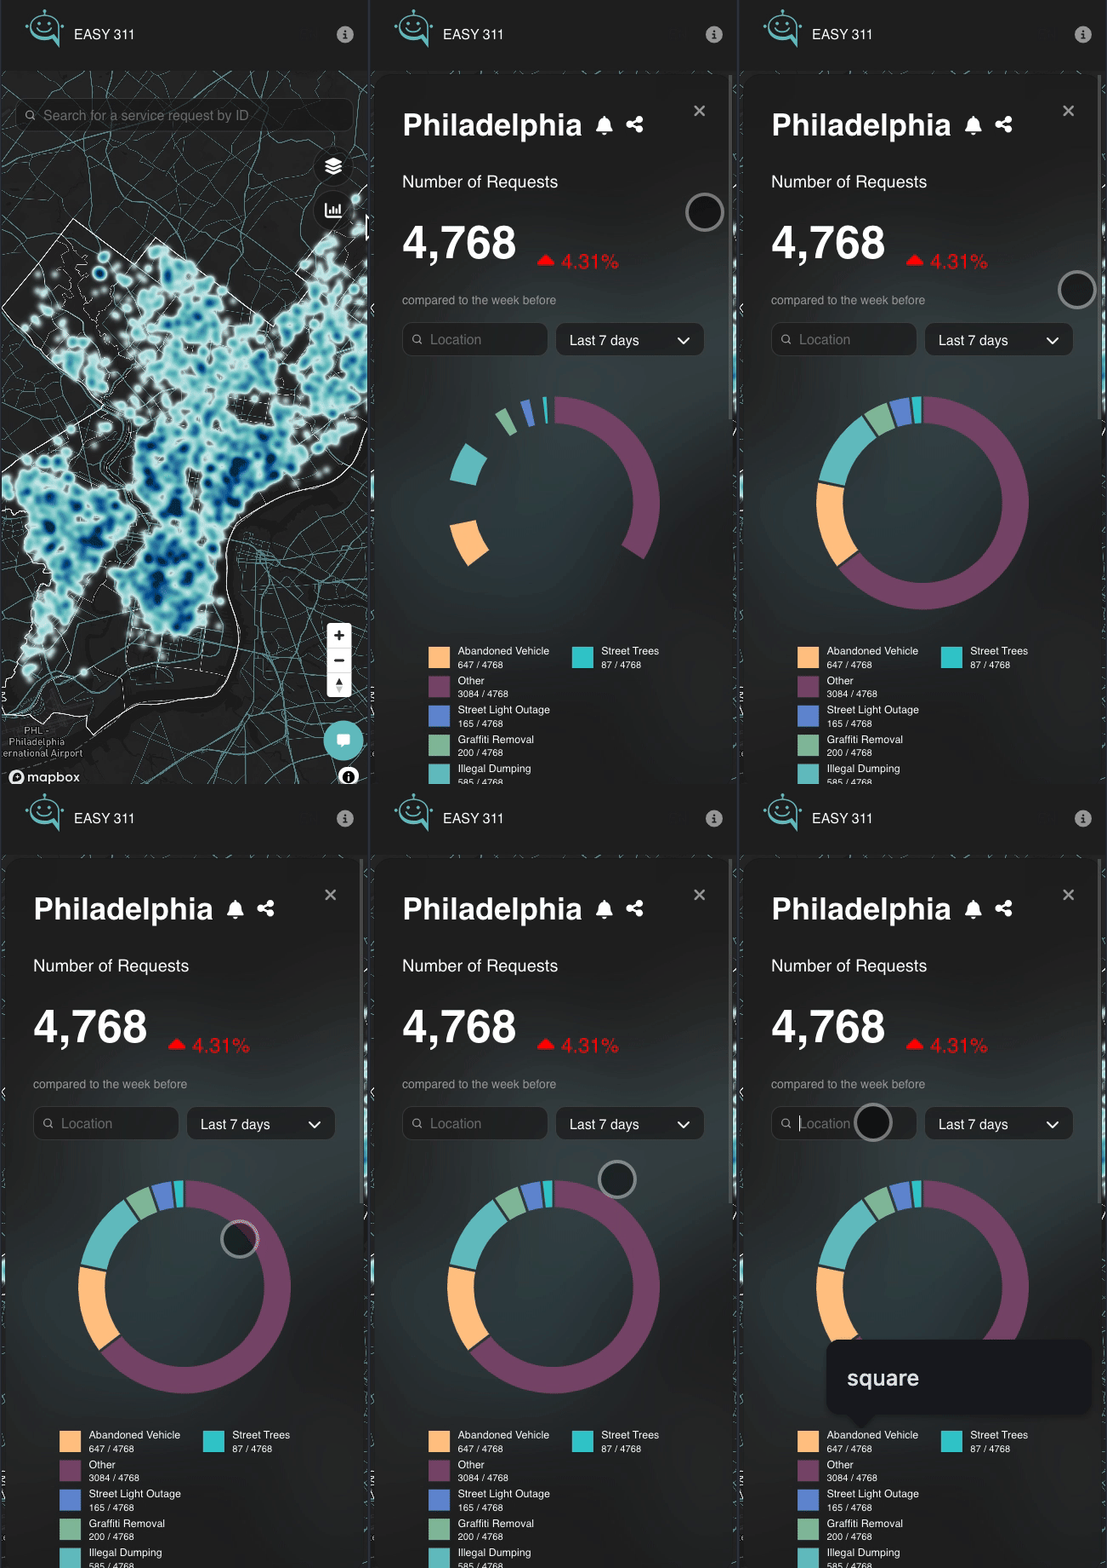
Not pictured, but users can share links to certain requests as each request has public id which can be queried in the search params. This feature was also inspired by Spatial Equity where users can share certain issues with others via a link.
Implementation
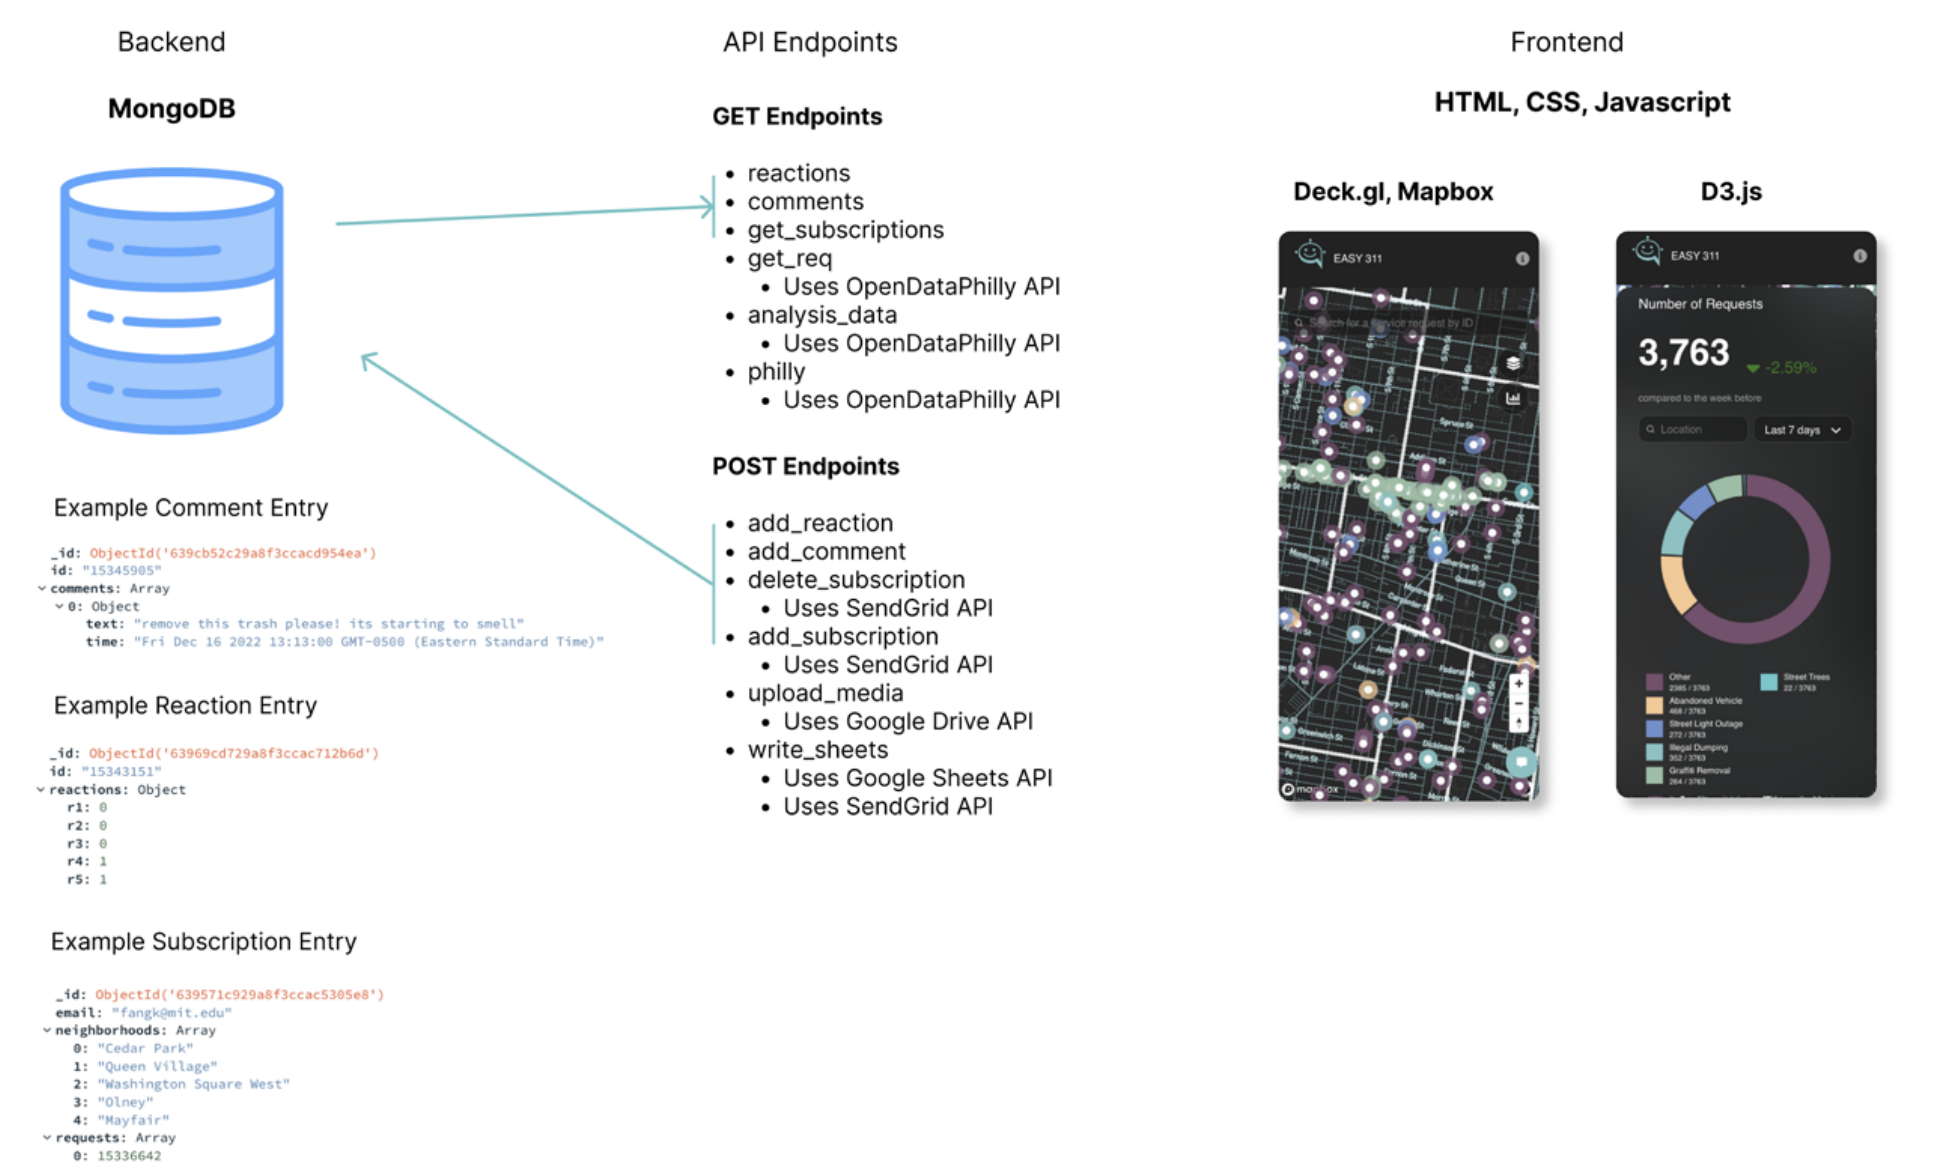
EASY 311’s backend is programmed with Node.js and Express.js frameworks for server and route management. It connects to a MongoDB database that stores service requests, comments, reactions, and user subscriptions.
The frontend is developed using standard HTML, CSS, and JavaScript within a React.js framework. The interactive map visualization is built with Deck.gl using a Mapbox base layer, and the neighborhood analytics are visualized with D3.js.
The backend uses REST APIs to GET and POST to external endpoints like Google Sheets and Google Drive for storing submissions, or OpenDataPhilly to retrieve service request data. The web application is hosted on Heroku’s basic dyno plan under the custom domain name www.easy311.app.
Contributions
Kelly Fang was the sole software developer on the team. Prim Rattanathumawat was the primary UI/UX designer. Ally Minju Hong and Tzu Tung Lee assisted with project management and communications.